The Startup Revolution Series — Part 2: The Decline of the Blue Chip

by Max Marmer, Compass Co-Founder Emeritus
This is the second post in the Startup Revolution series. The first may be found here.
In the last post, we suggested humanity may be approaching—or have already passed—the tipping point between the Industrial and Information Eras. Now we will delve deeper into why the old wisdom no longer seems to apply and blue chip companies are far from the reliable investments they used to be.
Let’s start with the good news.
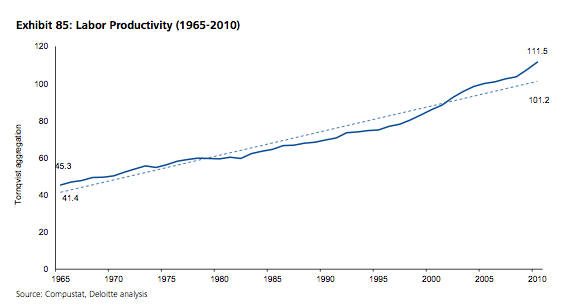
Since 1965, labor productivity has more than doubled. Economists define the inputs to this calculation as number of hours worked and the outputs as industry growth. In some industries, such as technology and telecommunications, labor productivity has grown more than 800%. Productivity is usually considered a key performance indicator for economic growth, so companies are growing faster than ever, right?
Not so fast.
During the same time period, companies experienced a 75% decline in Return on Assets (ROA) and a decline of almost 80% in the length of time an S&P 500 company could expect to remain on that list.
Better productivity, worse results. What is going on behind the scenes to lead to such diverging indicators?
For answers, we turn to the monumental Shift Index, released in 2009, by John Hagel, John Seely Brown and Lang Davidson of the Deloitte Center for the Edge, that documents the long-term decline of business. While the report focused solely on American companies due to the availability of data, it would be a mistake to assume their conclusions are purely US-based.
They found two clear trends that cannot be ignored: declining company performance and an increasing topple rate. First let’s look at the what, then we’ll explore the why.
Declining company performance
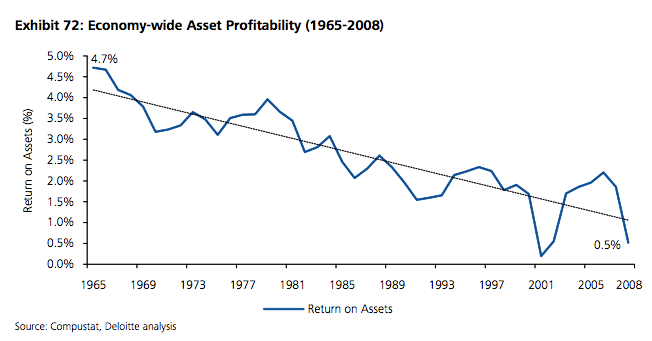
While there are a number of ways to measure growth metrics (such as return on invested capital), the Shift Index authors focused on ROA as it measures how much a company is able to do with what is has — in other words, how much profit it can make by turning its inputs into outputs.
When they reviewed data for the past 45 years, the authors and the community at large were equally surprised to find a drop of 75%. And while recessions in 2001 and 2008 clearly added to poor performance, the graphed results show a long-term trend that’s challenging to explain away as the result of anomalies.
At the same time, anyone who has spent much time with statistics knows that averages can provide useful high-level perspective, but can also skew conclusions if a small number of data points vary widely from the rest. So to gain a sharper perspective, the authors separated the companies into performance quartiles. The results showed “The ROA Performance Gap between winners and losers has increased over time, with the winners barely maintaining previous performance levels, while losers experience rapid deterioration in performance.” In other words, not only were poor performers dropping rapidly, even the best companies were only stagnating.
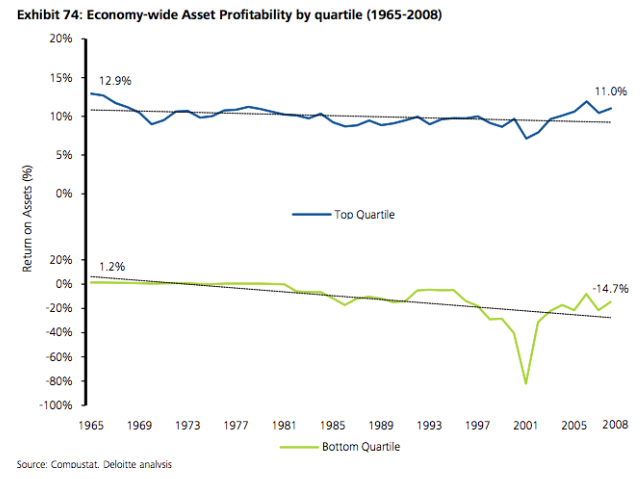
The authors concluded “After questioning and re-questioning our data and our assumptions, we came back to the same conclusions. The downward trend in company performance is accurate, the assumptions are reasonable, and further analysis confirms these persistent trends.”
Increasing topple rate
In addition to declining performance of the blue chip category, it also appears the success of market leaders is increasingly short-lived.
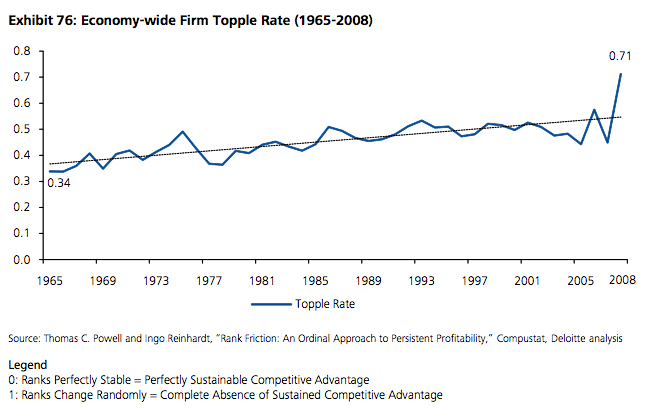
In the following graph, topple rate is defined as the propensity of market leaders on the S&P 500 list to ‘topple’ from their leading rank, and thus off the list. The authors describe the findings best: “Back in the 1930s, a company coming on the S&P 500 list could expect to remain there for 65 years. In recent years, the average life-time of a company on the S&P 500 has declined to about 15 years, a decline of almost 80%.”
So those at the top aren’t staying there long. What about those at the bottom of the market?
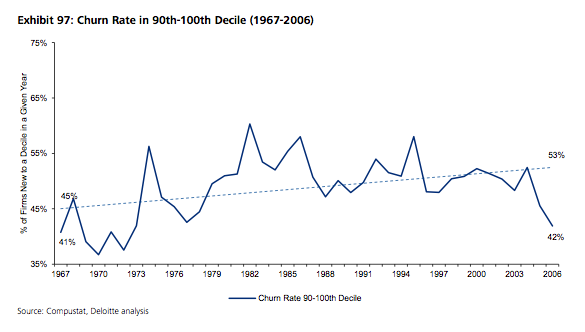
“The churn for the lowest cecile (0-10th percentile) has been declining, implying that fewer firms are performing poorly enough to sink to the bottom, and those that do are experiencing long, drawn-out declines.”
Why is performance declining?
Now that we’re clear about what is happening, the most important question to answer is why. It would seem to be a paradox -- increasing productivity along with declining results but there is an answer. In a word, it’s pressure. During the Industrial Era, companies were somewhat insulated by low levels of competition, information obscurity and growing consumption. But the Information Age has made those barriers more obsolete than castle walls after the introduction of gunpowder.
Let’s look at the three new fronts they must face in detail.
As read on Startup Compass.